
The Short Answer
When a church’s cost per lead jumps, the ad is usually not what broke. Read 7 numbers in the order your money moves, and stop at the first one that changed. In the week below, people kept clicking at almost the same rate. They stopped finishing the form. New videos would have fixed nothing.
The week it happened
One of the churches I run ads for had a rough week at the end of August. The week before, their ads brought in 37 people who planned a visit. That week they brought in 14. Cost per lead went up 164%.
The first read on it was tired ads. People have seen the same 3 videos too many times, so you record new ones. That is the usual advice, and the pastor spends his Saturday filming.
That first read was wrong. I only know it was wrong because of the table below.
| What I checked | Aug 23 to 29 | Aug 30 to Sep 5 |
|---|---|---|
| Cost to reach 1,000 people | $19.97 | $18.94 |
| People reached | 7,002 | 7,263 |
| Times each person saw it | 1.70 | 1.73 |
| Click rate | 6.27% | 4.93% |
| Clicks | 298 | 275 |
| Planned visits | 37 | 14 |
| Clicks that finished the form | 12.4% | 5.1% |
Look at the first 5 rows. Meta got a little cheaper. More people saw the ad. Clicks dropped by 23, which is about 8%. Nothing in those rows explains losing 62% of the leads.
Then look at the last row. The week before, 12 out of every 100 people who clicked finished the form. That week it was 5. The people were still coming, and they were leaving at the form.
The 7 numbers, in order
Ads Manager will show you over 100 numbers. You need 7 of them, and the order matters more than the numbers do. This is the path your money takes from the moment you pay Meta to the moment a family plans a visit.
- Cost to reach 1,000 people. This is what attention costs in your city, and you mostly cannot control it.
- Reach. This is how many people saw the ad.
- Impressions. This is how many times it was seen in total.
- Frequency. This is how many times each person saw it. A high number on a small reach means you keep hitting the same people.
- Click rate. This one is your hook. 1% is average and 3% is doing great. The churches I run sit between 4.9% and 7.8%.
- Form completion. This is planned visits divided by clicks, and almost nobody tracks it. Around 10% is healthy for our churches. At 5% something is wrong.
- Cost per planned visit. This is the result, and it is never the diagnosis.
Start at the top and walk down. The first number that broke is your problem. Everything under it is only a symptom.
Most pastors start at number 7, because that is the one on the invoice. It tells you something broke. It cannot tell you what.
2 problems that look the same
When the click rate falls and form completion holds, you have a creative problem. People are scrolling past, so you record something new.
When clicks hold and form completion falls, you have a form problem. A new video sends more people into the same hole.
On the invoice these 2 look identical, because the budget is the same and the leads are down. They have opposite fixes, and the wrong fix costs you a month.
Want us to walk your ad account through these 7 numbers?
Book a Strategy Call The call is free and runs about 30 minutes.Check the church next door
Before I call anything a trend, I look at 1 or 2 other churches for the same weeks. If Meta changed something, everybody moves together.
They did not move together. One church saw form completion rise from 4.6% to 9.0% in those same 2 weeks. Another dipped a little, from 12.6% to 10.2%. So it was not Meta and it was not the season. It was one form at one church.
That matters because of what it does to the math. Getting that form from 5.1% back to 12.4% more than doubles the leads on the same spend. No budget increase gets close to that.
What I look at on the form
I open the ad on my own phone and fill the form out like a stranger would. Then I look for 3 things.
- I count the questions, because every extra question costs you people.
- I read the first screen of the form next to the ad. If the ad says one thing and the form opens with another, people back out.
- I submit it and see what happens next. A form that errors out or lands on a dead page will not tell you it is broken.
None of that is fancy, and my rule is simple scales, fancy fails. It is also the part that nobody looks at, because the ad is more fun to argue about.
Once the leak is fixed, see what your budget should be bringing in.
Open the CalculatorQuestions pastors ask
Why did my church Facebook ads suddenly get more expensive?
Cost per lead is the last number in the chain, so it moves when anything above it moves. Check what Meta charged to reach 1,000 people, then your click rate, then how many clicks finished the form. The first one that changed is the cause.
What is a good click rate for a church ad?
Across most industries 1% is average and 3% is doing great. The Plan Your Visit ads I run for Spirit-filled churches sit between 4.9% and 7.8%. If yours is above 3%, your hook is probably not the problem.
How many people who click should finish the form?
On the instant forms we use, around 10 out of every 100 clicks is healthy. When it drops near 5, I stop looking at the ads and start looking at the form.
Disclaimer. The results in this article belong to the specific churches and events named and are not a promise of what your church will experience. Growth depends on your city, your budget, your follow-up execution, and how consistently your team works the system.
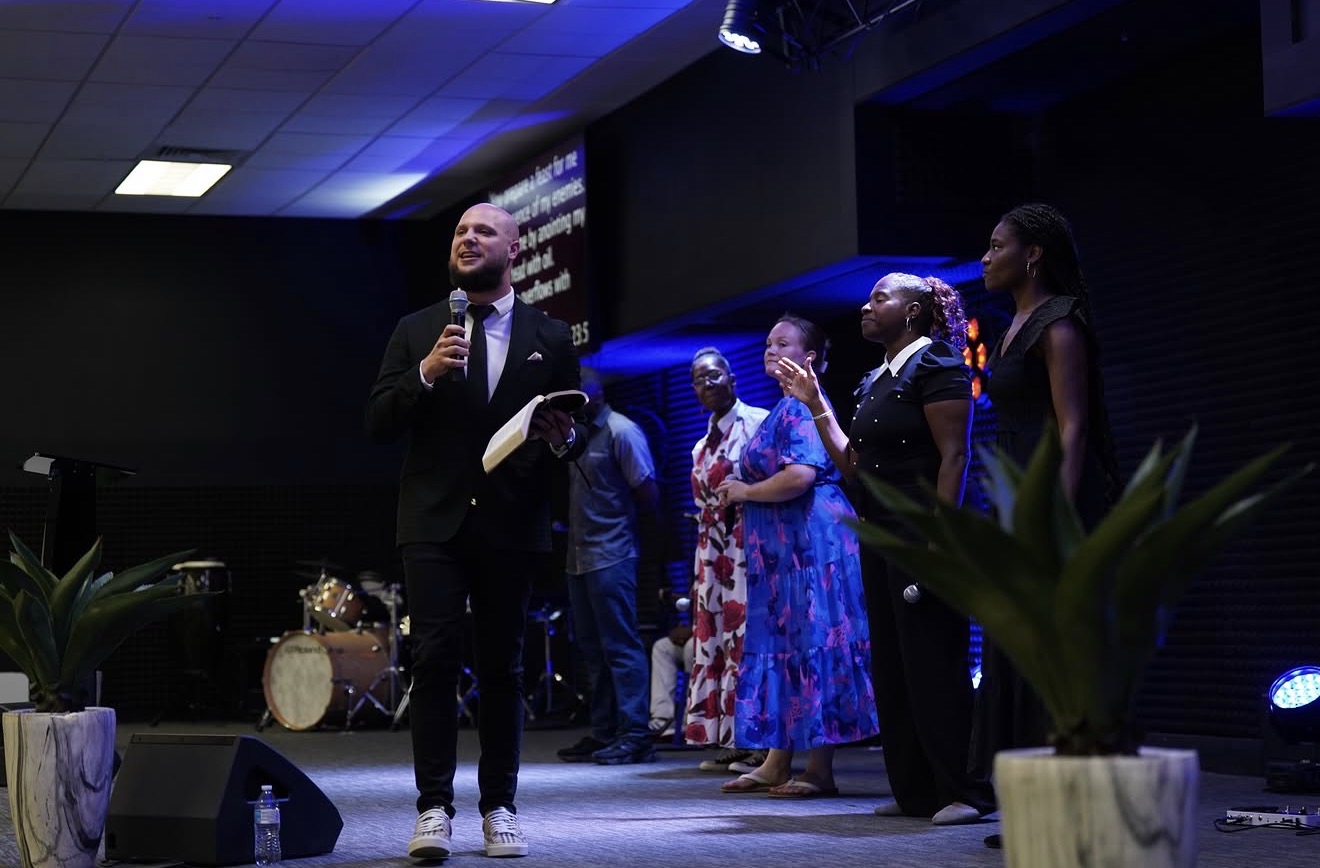
I am an associate pastor at River Church Baltimore and the founder of Church Amplified. I have personally spent over $1,000,000 on my own ads, and I run Facebook and Instagram ads for Spirit-filled churches across the United States.